What Is Save Percentage in Hockey?
Save percentage is hockey's go-to goalie stat, but it counts a point-blank chance and a 55-foot floater as the same shot. Here's the SV% formula, what counts as good in 2026, and why the number quietly lies.
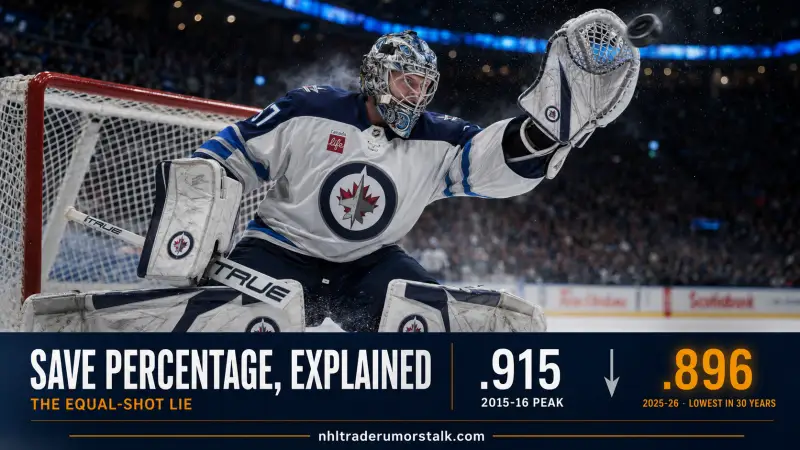
.896. That's the average save percentage NHL goalies posted across the 2025-26 season, the lowest league-wide mark in three decades and the first serious threat to finish a season under .900. A decade ago that number would have gotten a starter benched. Now it's roughly league par.
Save percentage in hockey is the simplest goalie stat on the scoresheet: the share of shots a goaltender stops. It's also, quietly, the most misleading number a fan can quote. Because it treats a point-blank chance off a turnover and a harmless 55-foot floater as the exact same event, a goalie with a worse save percentage is often the better goalie. That contradiction has a name in this piece, and it's the whole story: the Equal-Shot Lie.
| Figure | What it represents |
|---|---|
| .915 | League-average save percentage in 2015-16, the modern high-water mark |
| .896 | League average in 2025-26, the lowest in 30 years and the first sub-.900 threat in that span |
Nineteen points vanished in a decade. That collapse is the first reason a raw save percentage can't be read in a vacuum, and it sets up the bigger one: the Equal-Shot Lie hiding inside every goalie's line.
Key Takeaways
- The formula: Save percentage is saves divided by shots on goal, written as a three-decimal number in North America (.915 means a goalie stopped 91.5% of shots).
- The Equal-Shot Lie: It weighs every shot the same, so a goalie behind a leaky defense can post a worse number while actually playing better.
- What's "good" moved: A good NHL save percentage is .905-.920 and elite is .920+, but the 2025-26 league average fell to roughly .896.
- The honest benchmark: Dominik Hasek's .9223 career mark is the gold standard; Jacques Plante owns the highest single season at .9437.
- The fix: Goals saved above expected (GSAx) and high-danger save percentage adjust for shot quality, which raw save percentage ignores.
What Save Percentage Actually Measures
Take every shot on goal a goaltender faces, count how many he stops, and divide. A goalie who faces 30 shots and allows 2 made 28 saves, for a save percentage of 28 divided by 30, or .933. North America writes it as a decimal that reads almost like a baseball average; the international game writes the same stat as a true percentage, so that .933 becomes 93.3%.
Two things deliberately don't count, and both matter. Empty-net goals are off the books, because a pulled goalie isn't on the ice to be scored on, so that puck never registers as a shot against him. Shootout shots are tracked separately too, on the logic that a breakaway duel tests a different skill than stopping a 5-on-5 scramble. Strip those out and you're left with the cleanest version of the question fans actually want answered: when a real shot came, did the goalie stop it?
It pairs naturally with goals-against average, the other classic goalie number. Where GAA counts goals per 60 minutes (a volume stat that punishes a goalie for a busy night), save percentage is a rate, and a busy night with lots of saves can actually help it. That's why the two often disagree, and why neither alone tells you who the better goalie was.
What Counts as a Good Save Percentage
For most of the 2010s the math was simple. A good NHL save percentage sat between .905 and .920. Anything north of .920 was elite, the range that fills All-Star rosters and wins the Vezina conversation, while anything below .900 flagged trouble. As recently as 2023-24 the league average sat around .903, so .900 still meant a goalie was below the pack.
| Range | Read |
|---|---|
| .920+ | Elite; Vezina and All-Star territory |
| .905-.920 | Solid NHL starter |
| ~.900 | Roughly league average in 2025-26, below par historically |
| Under .900 | Traditionally a job-in-danger number |
Then the floor dropped. Goalies aren't worse; shooters are better and far more selective, the league shrank goalie equipment, and teams now chase scoring chances instead of shot volume, which keeps the benchmark in motion. Kings veteran Anton Forsberg put the era in plain terms.
"Back in the day you could let in four and still have a .900. Let in four now, you probably have an .800 save percentage." — Anton Forsberg, Los Angeles Kings goaltender, NHL.com (March 2026)
His teammate Darcy Kuemper went further, telling NHL.com flatly that ".900 is the new .915 or .920." The takeaway: never read a save percentage without knowing the season it came from. A .905 in 2026 is not the same animal as a .905 in 2016.
Why Save Percentage Lies: The Equal-Shot Lie
Here's the flaw that drifting benchmarks can't fix. Save percentage counts every shot as one shot. A 5-foot rebound off a broken coverage and a 55-foot wrister through clean air both land in the same denominator, worth exactly the same. They are not the same save, and any beer-league goalie knows it.
That's the Equal-Shot Lie, and it bends the whole stat toward defense. A goalie buried behind a team that bleeds high-danger chances will face uglier shots and post a lower number while making harder stops. A goalie behind a structured club that funnels shots to the perimeter inherits easy looks and a shinier line. Park a great goalie behind a sieve and a fine goalie behind a wall, and the raw save percentage will often crown the wrong one. Vasilevskiy described exactly that grind from the crease.
"It's hard to stay mentally in those games, especially when it could be 15 shots and 12 scoring chances." — Andrei Vasilevskiy, Tampa Bay Lightning goaltender, NHL.com (March 2026)
Fifteen shots, twelve of them genuine chances. A goalie can stop ten of those twelve, lose 2-1, and walk off with a .867 that reads like a bad night even though it was the opposite: a great night in front of a defense that was on fire. The number lied, and it lies the other way just as often for goalies on elite defensive teams who never see the hard stuff.
The Fix: GSAx and High-Danger Save Percentage
The analytics era built tools to plug the hole. The big one is goals saved above expected (GSAx). It takes every shot a goalie faced, assigns each a probability of becoming a goal based on its location and type, totals those into expected goals, and subtracts the goals he actually allowed. Face 15 expected goals and allow 10, and your GSAx is +5: five goals saved beyond what an average goalie would have, given those same shots.
GSAx does what save percentage can't, stripping out the defense in front of the goalie and judging him on the difficulty of what he faced. High-danger save percentage does a narrower version of the same job, isolating only the dangerous chances so you can see who actually makes the hard saves versus who's living off perimeter floaters. None of this means save percentage is useless. It means it's a starting point, not a verdict, and it has to be read next to shot quality, not in place of it. The same logic shows up across the goalie stat family, from the crease and goalie interference rules that govern what counts as a shot to where a goaltender sits among the six positions on the ice. It's the same lesson hiding behind a skater's plus/minus or a team's penalty kill: a raw count means nothing until you know the context behind it.
The All-Time Bar
Want the honest ceiling? Dominik Hasek's .9223 career save percentage is the modern gold standard, a hair ahead of Johnny Bower, Ken Dryden and Tuukka Rask. The single-season record belongs to Jacques Plante at .9437. Those are the numbers a goalie chases, and they're worth knowing precisely because they came in eras you can date, against shot profiles you can picture. A career .922 means one thing in the dead-puck 1990s and another entirely in 2026.
| Factor | Score /10 | Read |
|---|---|---|
| Tells you who's the better goalie | 4 | Defense and shot quality contaminate it |
| Era-comparable | 3 | The benchmark moved 19 points in a decade |
| Quick at-a-glance health check | 8 | Still the fastest gut read on the scoresheet |
| Overall | 50/100 | A useful starting point, never the final word |
Save percentage is the right first question and the wrong last one. Read it to spot who's drowning or rolling, then reach for GSAx and high-danger save percentage before you call anyone elite or finished. The Equal-Shot Lie is baked in; you just have to read around it.
Written by Mike Johnson, NHL Senior Editor, 15+ years covering the league. Every benchmark and record was checked against NHL.com, Hockey-Reference and ESPN reporting; the goalie quotes were traced verbatim to NHL.com's reporting on the league-wide save-percentage decline. Published June 29, 2026. Corrections or factual disputes: editorial@nhltraderumorstalk.com.
Sources and Reporting
- NHL.com: goalie quotes on the declining benchmark and ".900 is the new .915."
- ESPN: 2025-26 league average and the 30-year low.
- TSN: the decade-long decline and 2015-16 .915 peak.
- Wikipedia: formula plus the empty-net and shootout exclusions.
- Hockey-Reference: career and single-season save-percentage leaders.
- NBC Sports: goals saved above expected (GSAx) methodology.
The Verdict: The Equal-Shot Lie
Save percentage isn't broken, but it's honest only about arithmetic, never about difficulty. It will tell you a goalie stopped 90.5% of his shots and stay completely silent on whether those shots were daggers or dump-ins. That's the Equal-Shot Lie, and it's why I'd never extend or bench a goalie on save percentage alone. Use it as the headline, then read the fine print in GSAx. The next time a broadcast flashes a goalie's .905 like a verdict, ask the only question that actually matters: a .905 against what?
Frequently Asked Questions
What is a good save percentage in the NHL?
Historically, .905 to .920 is good and .920 or higher is elite. But the bar is sliding: the 2025-26 league average fell to roughly .896, the lowest in 30 years, so a .900 today is about average where it once meant a goalie in trouble.
How is save percentage calculated in hockey?
Divide saves by shots on goal. A goalie who stops 28 of 30 shots has a .933 save percentage, or 93.3 percent. Empty-net goals and shootout shots are both excluded from the calculation.
What is the difference between save percentage and GAA?
Save percentage is a rate, the share of shots stopped. Goals-against average counts goals allowed per 60 minutes. A busy night with many saves can lift save percentage but hurt GAA, which is why the two stats often disagree about the same goalie.
Why is save percentage considered misleading?
It treats every shot as equal and ignores shot quality. A goalie facing high-danger chances behind a weak defense posts a lower number than one fed perimeter shots, so a worse save percentage can mean a better performance. Goals saved above expected (GSAx) adjusts for that.
Who has the highest career save percentage in NHL history?
Dominik Hasek leads all NHL goalies at .9223. Jacques Plante owns the single-season record at .9437. Both came in different eras, which is why save percentage must be read against the shot environment of its time.
Related Stories

What Is a Zamboni? How It Works
A Zamboni shaves, sweeps, washes, and floods a rink with hot water in one slow 9.7 mph pass. Here is how the ice resurfacer actually works,...
By Mike Johnson · 10 min read

What Is GAA in Hockey?
What is GAA in hockey? Goals against average is goals per 60 minutes, the oldest goalie stat and the most misleading. How it is calculated,...
By Mike Johnson · 7 min read

Hockey Positions Explained
Hockey positions explained: six players per side, five skaters and a goalie. What the center, wingers, defensemen, and goalie each do, how l...
By Mike Johnson · 6 min read

What Is a Penalty Kill in Hockey?
What is a penalty kill in hockey? The short-handed team's stand against the power play, four against five. The rules that help the underdog...
By Mike Johnson · 7 min read
Comments
Be the first to share your take.
Get NHL trade rumors in your inbox
One email per week, zero spam, verified rumors only.